top of page

Ford Ka Project
Research for Marketing Communications - Winter 2022
Brand/Market Analysis
Project Objective
For this project, our group was instructed to conduct factor analysis and data reduction techniques to understand the potential for Ford's new and smallest vehicle, Ford Ka, to break into the small car industry.
Skills Utilized
Coding (R-studio), Data Interpretation, Statistics, Market Segmentation/Development Strategy and Thinking
Hallie DeVore, Grace Reininga
Team Collaborators
Process
Our group performed background research to gain an understanding of the market we were chosen to analyze and then performed several methods of data reduction. Through this project and with the assigned objectives, our group was able to learn various methods of data reduction techniques including factor analysis and cluster analysis. We also learned how to read and analyze the data from these data reduction techniques as well as be introduced with the coding software, R-studio.
1. Background Research
From the case study we understood that Ford developed the KA in order to respond to changes within the small car market. Historically the car market segmentation has been focused on:
-
Car size, engine output, production cost and price
-
Household income, household size, age and life stage
As of recent, environmental and demographic factors changing market segmentation to where there is a new focus on variety of customer preferences and needs including:
-
Environmentally conscious customers interested in low fuel emissions
-
Increased traffic congestion, city parking – change in car size preferences
-
Average household size is smaller than before – change in car size preferences
-
Women’s preferences, more women customers in market now
-
Price is less of a factor
-
Interior design, performance and ‘bells and whistles’ preferences
-
Design for “lifestyle aspirations”
1. Data Reduction Methods
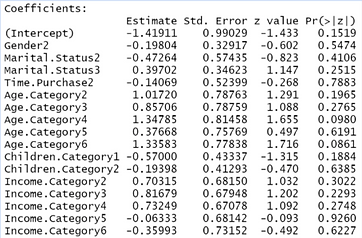
We were then given the data from a consumer survey of 62 questions and excel data of several demographic and non-demographic variables. We were asked to analyze whether the demographic variables had a significant relationship with our category groups. To determine their relationships were significance enough to separate out our categories, we performed regression analysis on R-studio. Using a significance value of 0.05 we determined that none of the demographic variables are significant because none of the P-values (far right column) in our data are below our significance level. Therefore the demographic variables do not separate out the our category groups.
We then chose to consider another category group and we chose to use Chi-squared tests and cross-tabs at a significance level of 0.05 across the three dependent variables to determine the significance of any relationships between variables. These results allowed us to conclude that only one demographic variable was significant because it’s p-value was below 0.05, no other independent variables had a p-value below 0.05. By adding this third categorical group, we determined that our results were not the consistent with the provided results (using two category groups). With the consideration of a third group, there is one independent variable does have an effect on the dependent variables and therefore a significant relationship with our categorical groups.

Next, we were asked to illustrate the process used for identifying the attitudinal segments, to identify the number of factors underlying the questions and name the factors. We conducted factor analysis methods on R-studio and sorted through the provided factor loading matrix as well as our own factor loadings. The images to the below reveal our data from the factor analysis methods we conducted both with and without rotation.

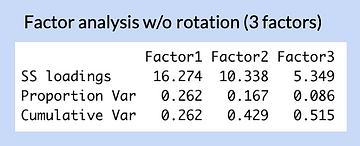
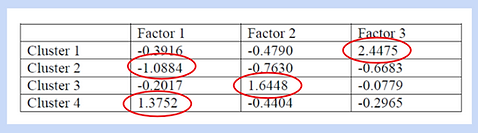
We deduced three overarching factors named 'Style', 'Standard' and 'Performance' respectively. The reasons for why we did so are explained in the chart below.

bottom of page